
Tuning the Mendel hot-end, using a Tcl/Tk script for temperature sampling. The firmware used is Marlin v1 on Arduino 1.3.
The Tcl script on OS X connects to the Arduino over USB. The original script was taken from a buildlog.net post.
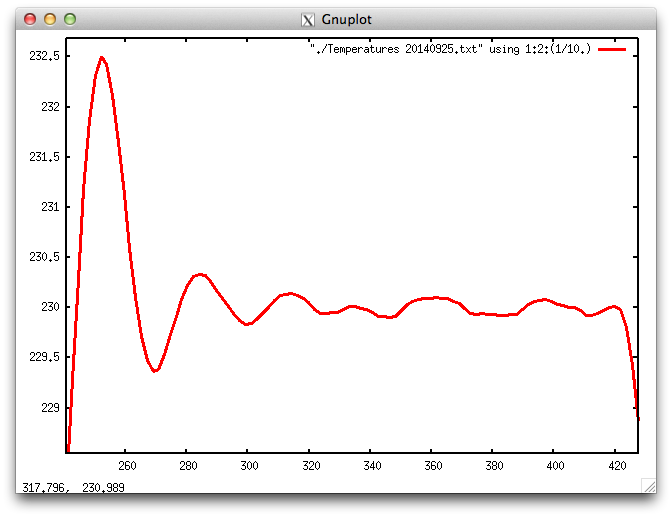
Example plot command in an interactive gnuplot session, which allows for mouse zooming:
$ export GNUTERM=x11 # allow interactive zooming (which Aquaterm does not support) $ gnuplot gnuplot> plot "./Temperatures.txt" using 1:2:(1/50.) with lines linecolor rgb "red" linewidth 3 smooth acsplines 2 notitle gnuplot> quit |
The PID settings were derived with the Marlin autotune option. FWIW, these are the parameters for my home-made Mendel hot-end:
    #define  DEFAULT_Kp 56.46
    #define  DEFAULT_Ki 4.14
#define DEFAULT_Kd 192.40 |